
Search
Search insights in the commercial insurance market without limits.

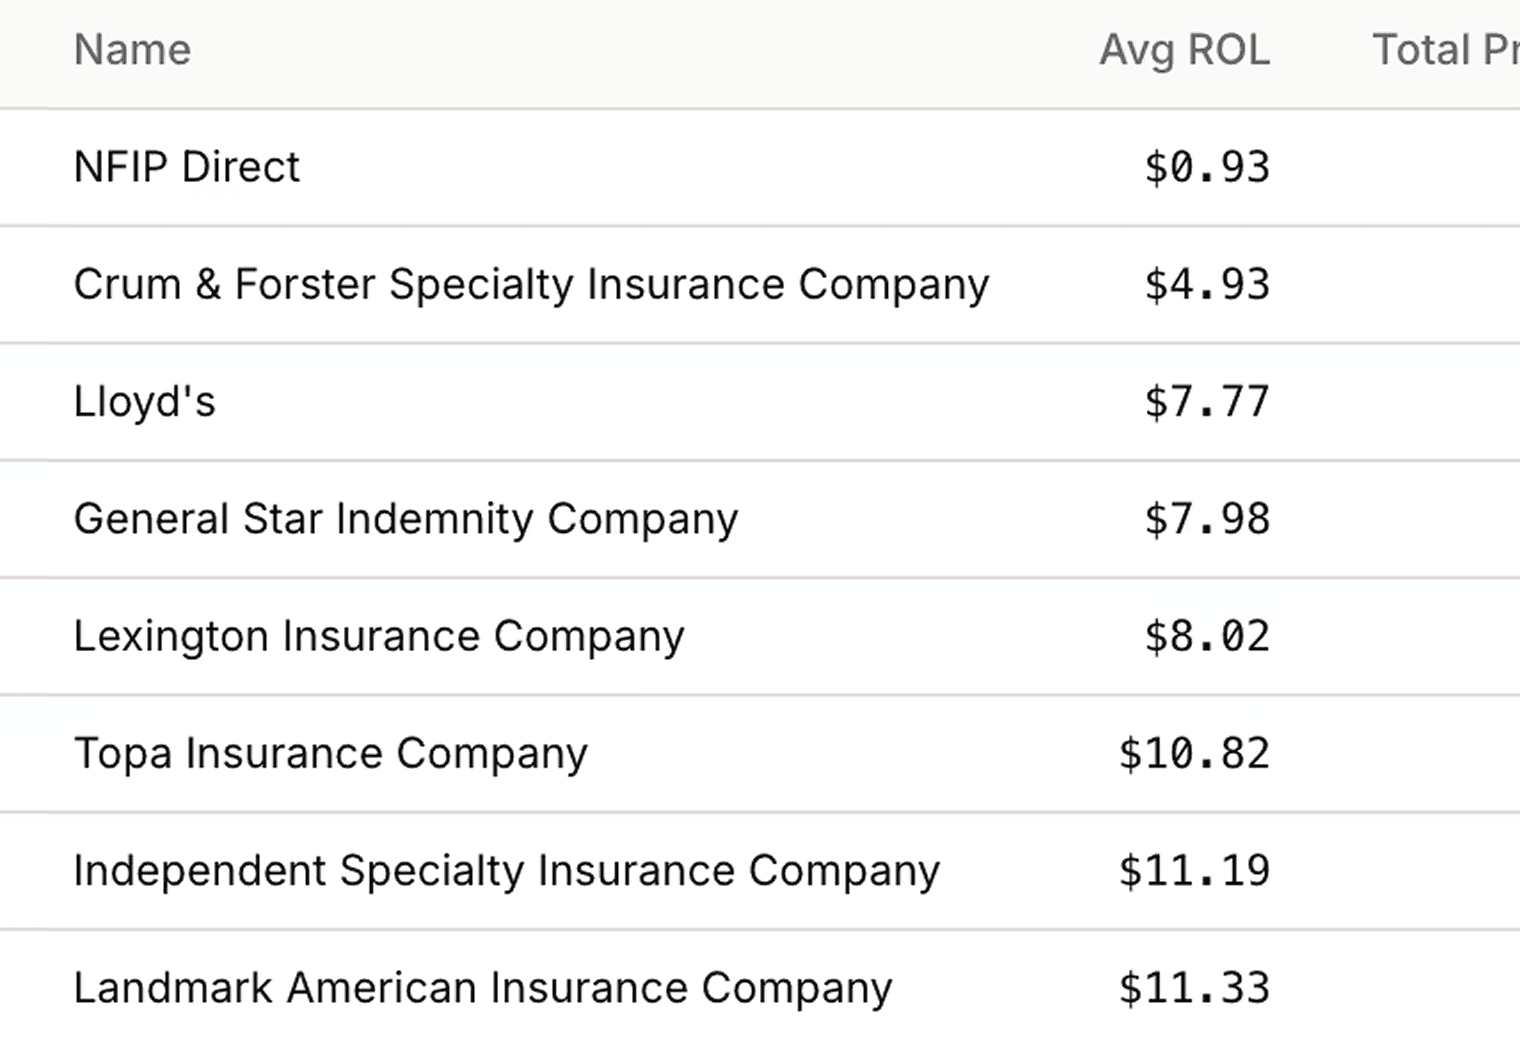
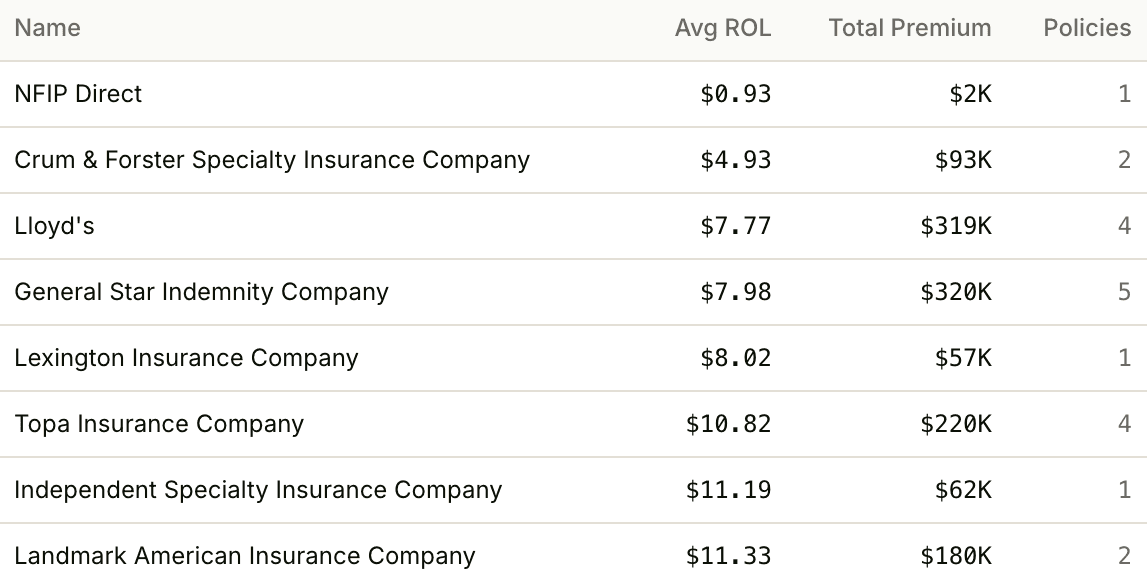
Transparency
Transparency by carrier.
See which carriers are writing the market right now. Search results show which carriers are active in a market, how their pricing compares, helping you uncover better placement options or where you can improve your own insurance program pricing.

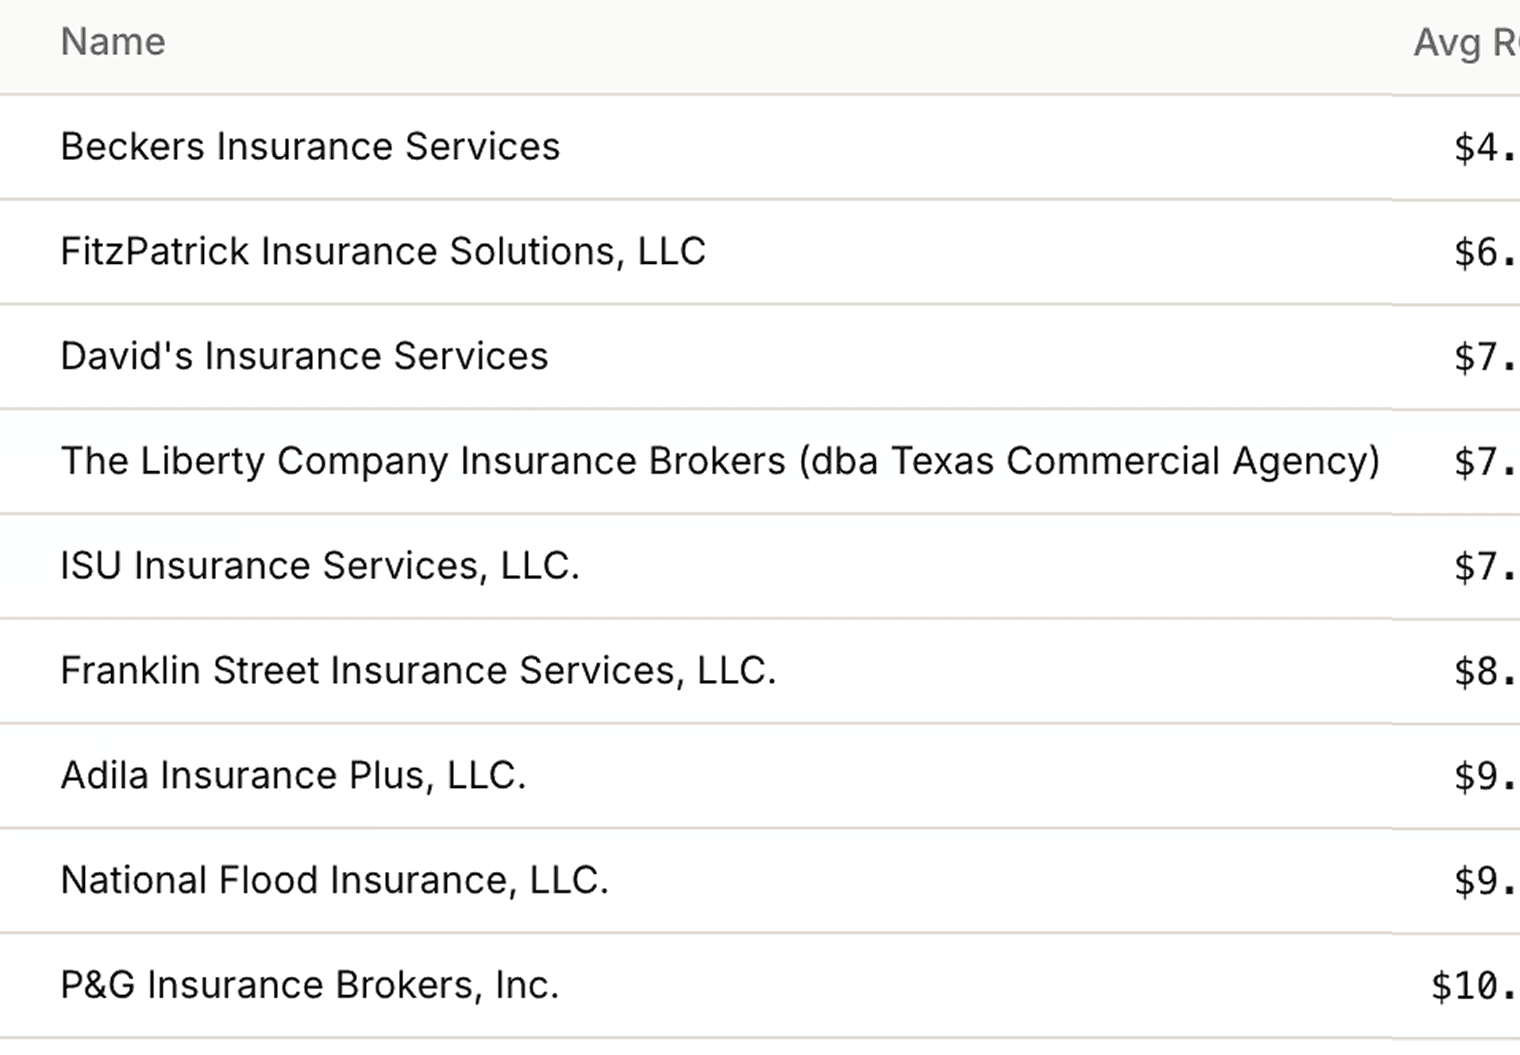
Transparency
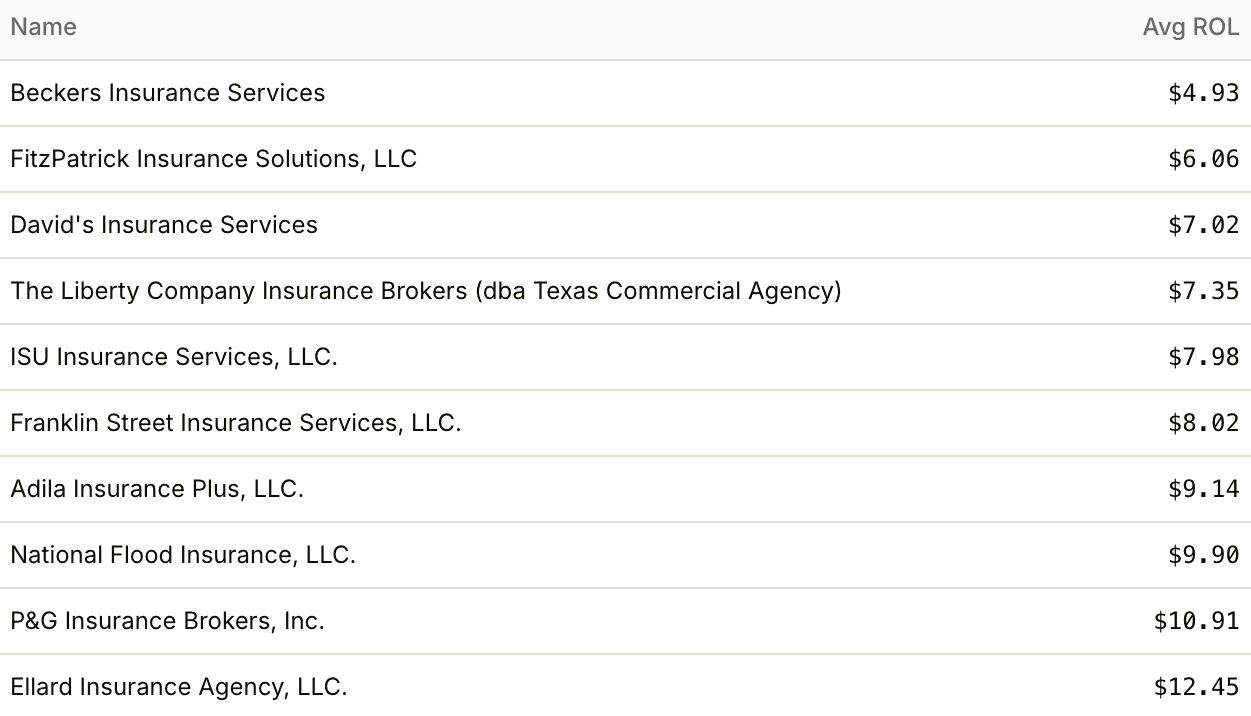
Transparency by brokerage.
See which brokerages control the market. Search results show which brokerages are active in each market and where premium is being distributed, helping carriers, brokers, and advisors understand the competitive landscape.

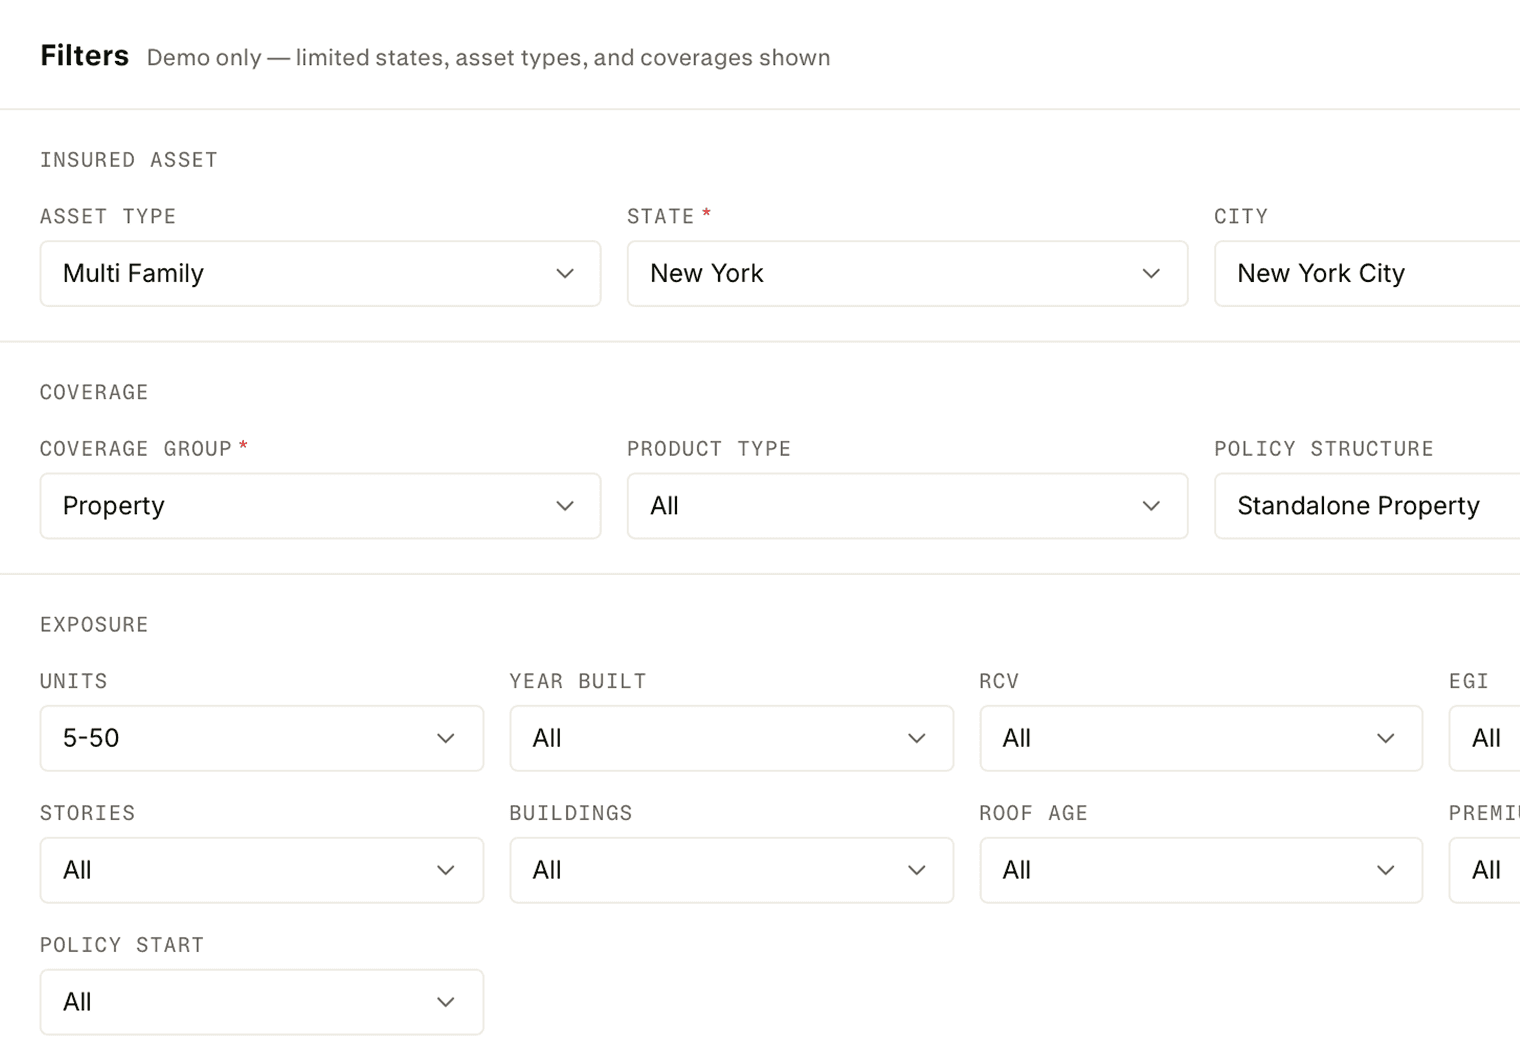
Appetite
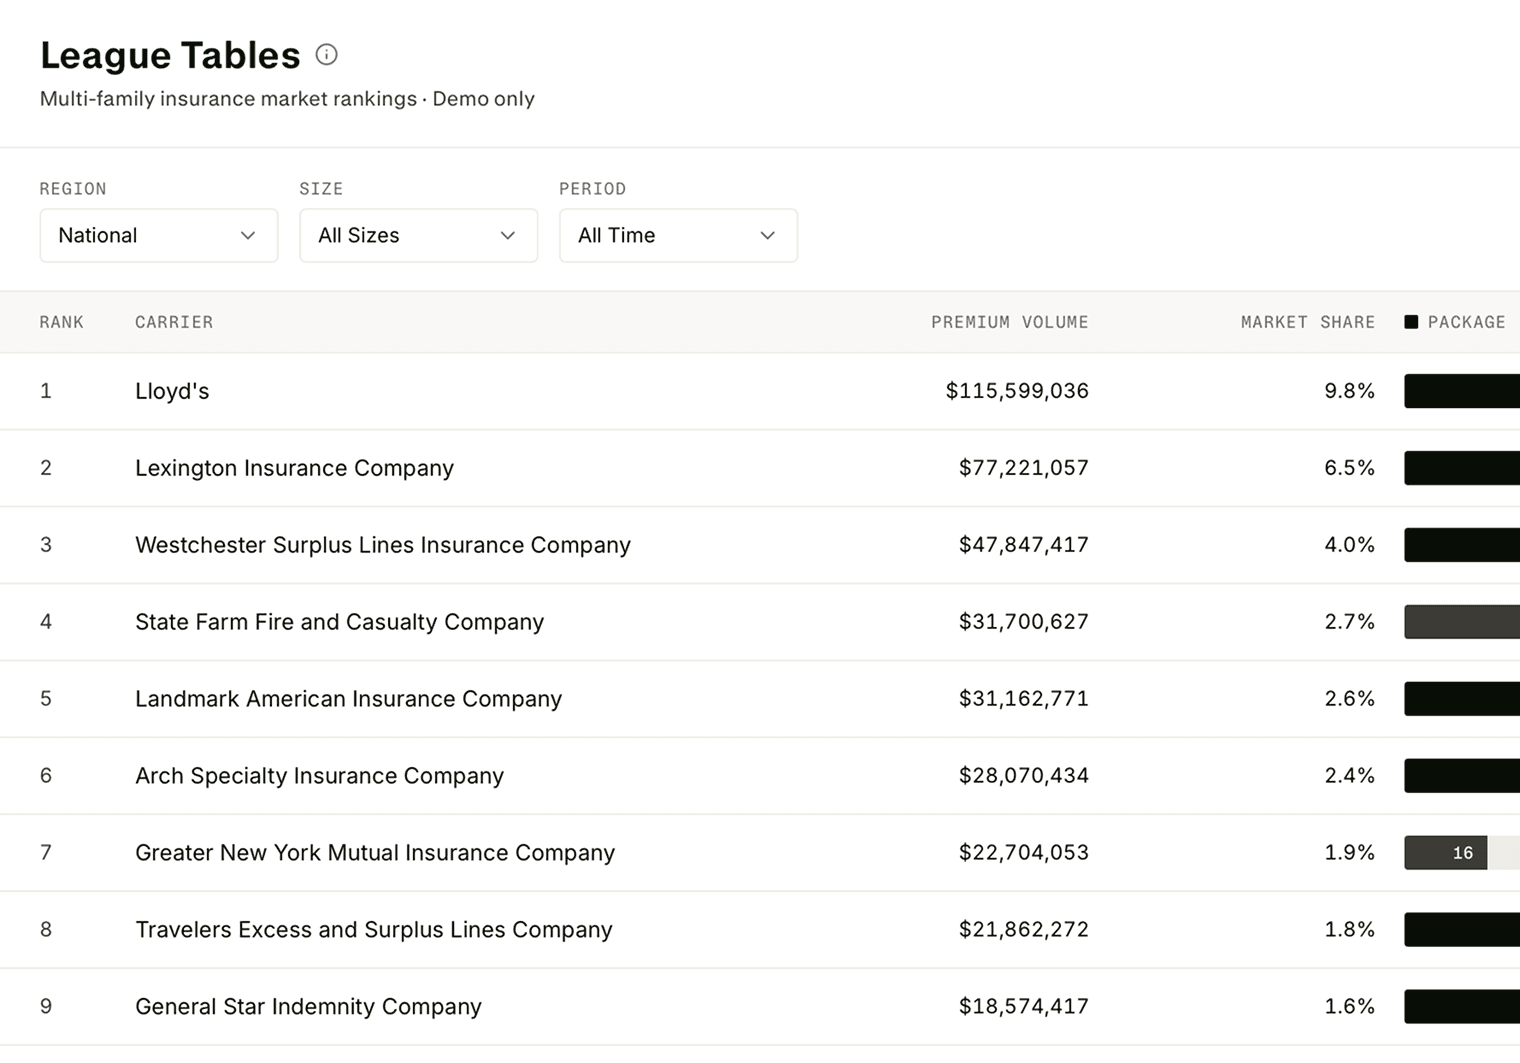
Know live carrier appetite and rankings
Which carriers are winning, by market? Detailed ranking data that uncovers the most active carriers.
Pricing
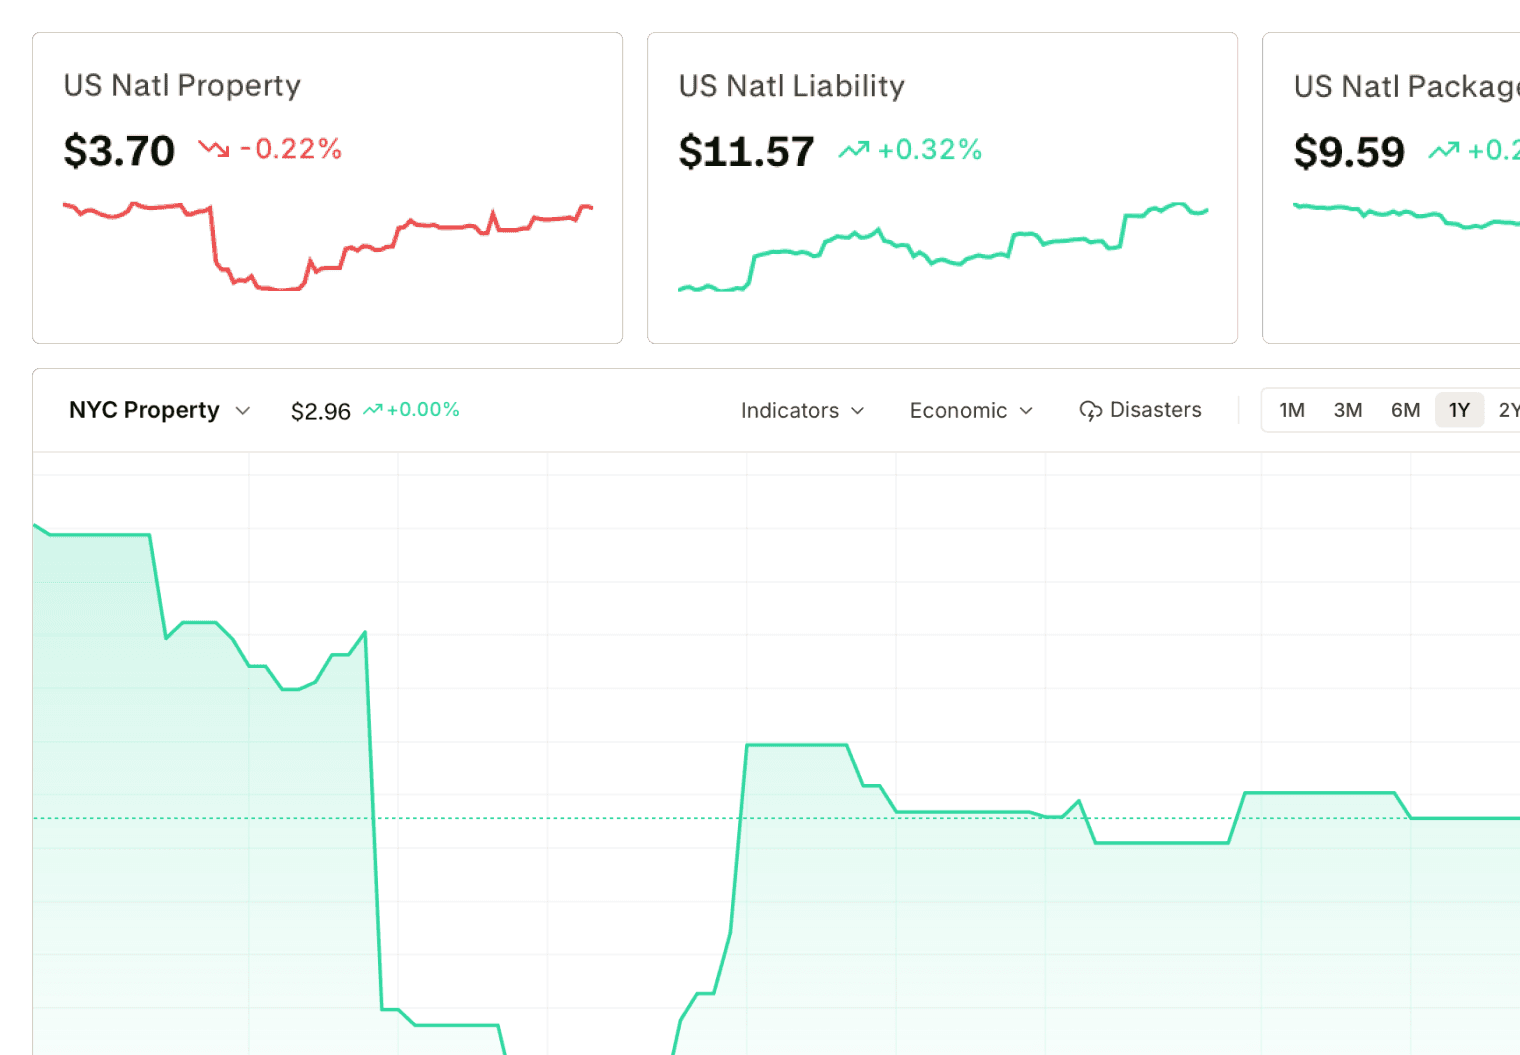
Track daily market pricing changes
Monitor real-time pricing movement across insurance markets, asset classes, and geographies. See when rates move, where pricing is softening or hardening, and which markets deserve attention before renewal.

Benchmark-driven advice.
Here now.
Free tier available. No credit card. Value in 10 seconds.